|
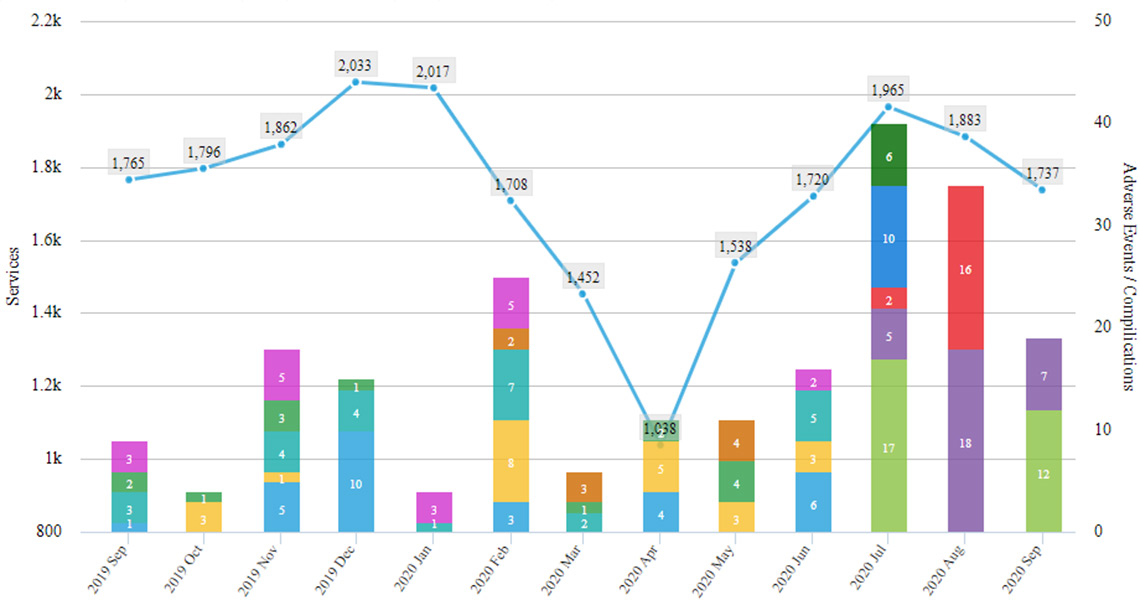
Illustration 1: Service volume (blue line) is trended by month for one year. Complicated Services/Services with Adverse Events are stacked by outcome over the same time period. © ConexSys, Inc. |
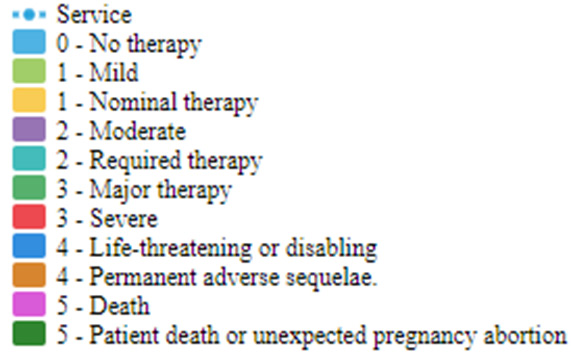
Sometimes data provides answers, sometimes it creates questions, however neither are possible if you’re collecting data that you’re not analyzing. Consider, for example, Illustration 1. This visualization was generated using HI-IQ®, and illustrates the anonymized data used with permission from an actual HI-IQ facility comprised of several hospitals in the United States. The blue line charts the volume of services provided by the interventional radiology department over the twelve month period from September 2019 through September 2020. The left y-axis corresponds to service volume. The stacked bars illustrate the number of services with complications or adverse events over the same time period, with each segment corresponding to the documented outcome of the complication or adverse event. Complication/adverse event frequency is tallied on the right y-axis.
What answers does this analysis provide? What questions does it raise? Certainly, it draws a very clear picture of the impact of COVID-19 on the IR service volumes for this user. Following that, the monthly trend in complications/adverse events raises some questions, given that the overall number of complicated services increase in Q3 2020 versus the earlier time periods shown. Why? Sicker patients due to the pandemic? A different case mix than prior months? New trainees onboard in July? Other? The reader will likely agree these are all questions worth answering, which may not have been apparent without access to this, or a similar, analytic tool.
Gain valuable insight into the data you collect by employing the growing library of visualization tools available in HI-IQ IRIS. With fast, direct access to data analytics you’ll quickly realize a return on investment from time spent on electronic documentation.